
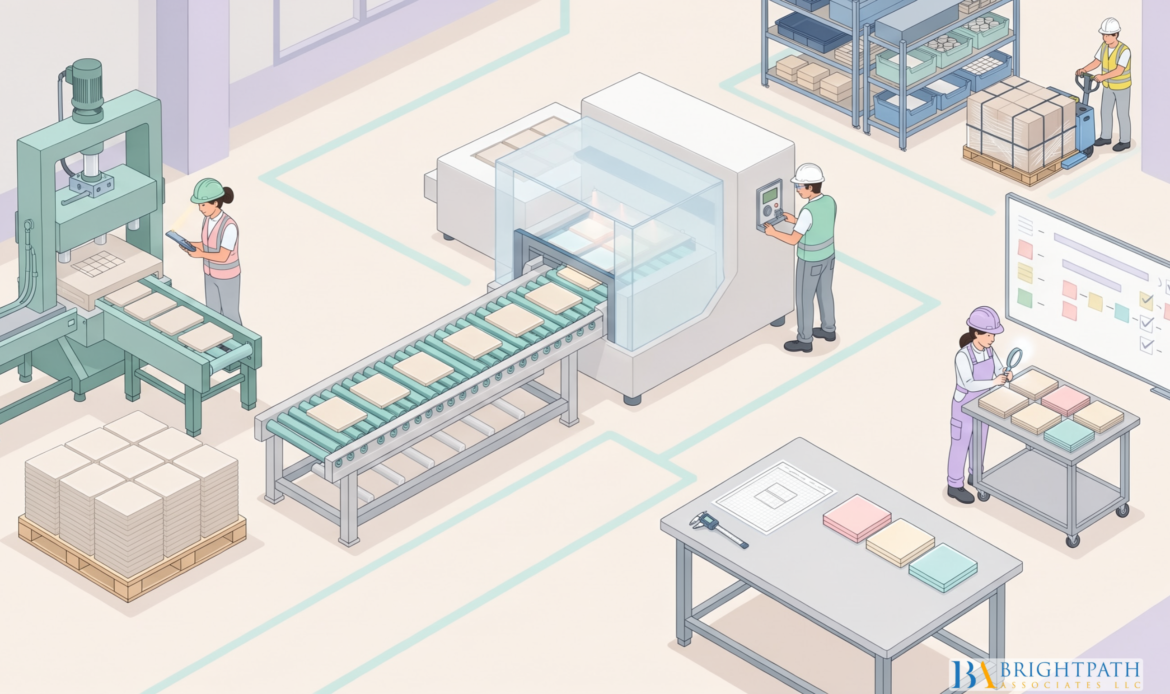
Boosting Ceramic Tile Production: Lean Manufacturing Case Study for Glass, Ceramics & Concrete Industry starts with a hard operational fact: a tile plant cannot improve output simply by running presses, dryers, or kilns faster. Thermal limits, moisture variation, changeovers, equipment availability, and defect patterns determine whether added speed becomes saleable tile or additional scrap. #LeanManufacturing gives ceramic producers a disciplined way to separate productive work from delay, rework, excess inventory, avoidable motion, and equipment losses. But Lean is not a shortcut around kiln physics or product quality. It is a management system for making constraints visible, solving the right problem first, and sustaining better operating conditions.
Table of Contents
• Key Takeaways
• Map Waste By Process Stage
• Use Case Evidence Without Overpromising
• Build A Sequenced Lean Operating System
• Align Leadership And Specialized Talent
• Frequently Asked Questions
• Resources And Citations
Key Takeaways
• Start with defect stratification, not a broad Lean launch. Separate pre kiln, kiln, post kiln, and breakage losses. Each category has different causes and needs different countermeasures.
• Use value stream mapping before buying technology. A current state map identifies where material, information, and decisions wait. Digital monitoring can improve visibility, but it cannot correct an unstable process by itself.
• Treat the kiln as a system constraint. Faster upstream flow is harmful if moisture, glaze application, loading patterns, or firing profiles create more warpage, cracking, shade variation, or rejects.
• Sequence Lean tools. Plants generally need stable work areas, reliable equipment, and standard work before they can gain much from pull signals or aggressive inventory reductions.
• Measure financial value through yield and capacity. A lower reject rate matters only when it reduces scrapped material, energy, labor, rework, lost production time, or missed customer demand.
• Leadership roles are becoming more cross functional. Operations leaders must connect process engineering, maintenance, quality, safety, data, and workforce capability rather than manage production volume in isolation.
Map Waste By Process Stage
Define Lean In Ceramic Tile Terms
Lean manufacturing is a method for improving customer value by removing work that consumes time, materials, energy, labor, or capacity without improving the finished tile. In a ceramic plant, that definition must be applied to the actual production route: body preparation, pressing, drying, glazing, firing, sorting, finishing, and packing.
A value stream map is a visual record of how material and information move from raw inputs to shipped tile. It shows cycle time, waiting, work in process, defects, handoffs, and decision points. It is useful because a plant may report a strong press output while finished goods wait for sorting, packaging, quality release, or shipment.
A pre kiln defect occurs before firing. It can include poor compaction, edge damage, inconsistent moisture, weak green strength, glaze defects, or handling damage. A #KilnDefect is associated with the thermal process, such as warpage, cracking, shrinkage variation, or shade inconsistency. A post kiln defect is found during sorting, finishing, handling, or packing. Overall equipment effectiveness, or OEE, combines availability, performance, and quality to show how much scheduled equipment time produced acceptable output.
These distinctions matter because a generic defect metric hides causality. If a plant combines all rejects into one percentage, the kiln team may be asked to solve breakage caused by downstream conveyors, or the press team may be blamed for a glaze related quality loss.
Find The Constraint Before Choosing The Tool
The first management question is not, “Which Lean tool should we deploy?” It is, “What currently prevents more first quality tile from reaching customers?” The answer could be a dryer with unstable moisture removal, a press changeover that consumes productive time, unplanned kiln downtime, or a sorting process that creates a queue after firing.
| Process Area | Common Loss Pattern | First Diagnostic Question | Suitable Lean Response |
|---|---|---|---|
| Pressing | Setup delay, mold issues, green tile damage | Is output lost during changeovers or during steady operation? | SMED, standard work, maintenance checks |
| Drying | Moisture variation, waiting, breakage | Does dryer output vary by product, shift, or line speed? | Process controls, root cause analysis, TPM |
| Glazing | Rework, wrong recipes, color variation | Are defects tied to recipes, viscosity, or operator handoffs? | Visual controls, poka yoke, standard work |
| Firing | Warpage, cracks, shade variation, downtime | Are rejects clustered by kiln zone, product, or loading pattern? | Defect stratification, TPM, thermal process review |
| Sorting And Packing | Breakage, misclassification, queues | Does damage occur before or after quality release? | Error proofing, material flow redesign, training |
SMED, or single minute exchange of dies, separates work that must occur while equipment is stopped from preparation that can happen in advance. In tile production, it can apply to mold, size, color, glaze, or product changeovers. It should not be the first priority when the major loss is kiln rejection or chronic equipment failure.
#TotalProductiveMaintenance, or TPM, combines planned maintenance with operator led cleaning, inspection, lubrication, and early abnormality detection. It is particularly relevant for presses, dryers, kilns, glazing equipment, and conveyors. A TPM and SMED production model reported 88.4% machine availability and reduced defective product rates from 5.44% to 1.97% after implementation, as documented in the LACCEI study of TPM and SMED results. The finding is useful as a benchmark, not a guaranteed outcome for another plant.
Protect Quality While Reducing Inventory
Just in time production is often misunderstood as “keep less inventory.” In ceramics, inventory buffers sometimes protect against genuine variation in drying, firing, product mix, inspection, or shipment schedules. Removing buffers before the source of variation is controlled can stop the entire line.
We recommend a staged test. First, establish the normal queue size and reason for each buffer. Next, reduce one controlled buffer for a defined period while tracking service, defects, stoppages, and expedited labor. If quality or delivery performance worsens, restore the buffer and address the upstream variation. This is more rigorous than declaring inventory waste by default.
The same caution applies to throughput targets. A press may produce tiles faster than the dryer or kiln can absorb them. That creates work in process, handling, damage risk, and misleading productivity reports. The relevant measure is saleable finished square footage per scheduled hour, not the highest local output at one machine.
Use Case Evidence Without Overpromising
What Ceramic Lean Studies Actually Show
International case studies provide useful evidence, although they are not direct forecasts for United States plants. A 2025 Indian ceramic case integrating Lean methods and Industry 4.0 reported a 10% reduction in processing time, a 12.54% reduction in waiting time, and defect reductions of 27.45% before firing, 14.65% in kiln operations, and 21.83% after firing. It also reported a 24.82% reduction in broken tiles. The Indian Lean and Industry 4.0 case study is especially useful because it separates defects by process stage rather than presenting one blended reject number.
A separate medium sized ceramic industry case reported a 32% reduction in waiting time, a 36% reduction in inventory, a 40.51% average defect reduction, and approximately US$0.61 million in savings during one financial year. Those outcomes are reported in the Springer ceramic Lean implementation case study. They demonstrate possible improvement magnitude, but local economics, product mix, energy costs, equipment condition, and baseline performance determine whether a similar result is plausible.
A ceramic tile value stream mapping case reported a 26% reduction in identified waste, an 8.33% reduction in unnecessary inventory, a 21.57% reduction in color mixing work time, a 2.67% lead time reduction, and a 2.70% increase in value added ratio. These results support a basic point: mapping can identify flow losses that individual departments may not see.
Why Isolated Tools Rarely Deliver Durable Results
A Spanish empirical study of 76 ceramic tile companies found that standardized operations, TPM, and quality controls were relatively widespread. Kanban, setup reduction, multifunctional employees, group technology, and visual factories were less common. The Spanish ceramic tile Lean production study also found few correlations between isolated Lean practices and operational indicators.
That result challenges the common “install one tool, get one outcome” narrative. A visual board cannot compensate for unstable equipment. A Kanban system will not fix poor forecast discipline. A fast changeover has little value if #ProductQuality fails after firing.
This is why Lean should be managed as an operating system. Standard work establishes the expected sequence. Visual management makes abnormal conditions visible. Root cause analysis explains recurring losses. Kaizen creates a routine for small improvements. TPM protects availability. Together, these practices improve the odds that gains will hold after the initial project team leaves.
For related manufacturing context, Lean manufacturing drives growth in the paper industry examines how waste reduction and process discipline can support operational performance across process industries.
Lean Plus Industry 4.0 Requires Attribution Discipline
Industry 4.0 refers to connected sensors, automation, data systems, analytics, and digital controls used in manufacturing. These tools can help teams see kiln temperatures, equipment alarms, quality signals, cycle times, and maintenance conditions sooner. They do not automatically create a better process.
A plant should separate the effect of process redesign from the effect of new data visibility. For example, if a line adds sensors and reduces kiln rejects, leaders should ask whether the gain came from earlier detection, a revised loading pattern, a changed firing curve, better maintenance response, or several actions together. Without a baseline and a control period, the plant may spend heavily on technology without knowing what created value.
Build A Sequenced Lean Operating System
Start With A 90 Day Baseline
Before setting targets, collect at least 90 days of consistent data by product family, line, shift, and defect stage. The goal is not perfect data. It is a credible baseline that prevents product mix changes from being mistaken for improvement.
| Metric | Practical Definition | Why Executives Should Track It |
|---|---|---|
| First pass yield | Acceptable tile divided by total tile produced | Shows whether output converts to saleable product |
| Pre kiln defects | Rejects before firing divided by pre kiln output | Separates forming, drying, glazing, and handling issues |
| Kiln defects | Thermal related rejects divided by kiln output | Focuses attention on firing stability and loading conditions |
| Breakage rate | Broken tiles divided by units handled | Distinguishes handling damage from process quality loss |
| OEE | Availability × performance × quality | Connects downtime, speed loss, and defects |
| Changeover time | Last good unit to first good unit | Measures setup losses without masking quality checks |
| Lead time | Release to finished goods availability | Reveals waiting and excess work in process |
The financial model should be equally direct:
Annual improvement value = avoided scrap cost + avoided rework cost + recovered contribution from added saleable capacity + avoided overtime or expedited freight − implementation cost.
Avoided scrap should include body materials, glaze, packaging where applicable, labor, handling, and energy already consumed. Recovered capacity should be valued conservatively. If demand is constrained, extra capacity may have no immediate revenue value, although it can still reduce overtime or improve #DeliveryReliability.
Sequence The Work Instead Of Launching Everything
A disciplined sequence reduces confusion and change fatigue.
- Map the current state. Include material flow, information flow, queues, defect points, downtime, product families, and quality release decisions.
- Stabilize the largest loss. If downtime dominates, prioritize TPM. If defects dominate, stratify defects and run root cause analysis. If changeovers dominate, apply SMED.
- Standardize the proven fix. Define settings, work sequence, inspection points, escalation rules, and training requirements.
- Make abnormalities visible. Use clear labels, defect codes, line status signals, maintenance tags, and daily tier meetings.
- Reduce buffers only after stability improves. Use pull signals where variation is controlled and the downstream process can reliably consume output.
- Audit and adjust. Review whether the change holds across shifts, products, and maintenance cycles.
A Frontier Ceramic case focused on post bisque firing kiln rejection and reported an average 40% reduction after 5S, Kaizen, autonomous maintenance, and related activities. The reported result belongs to that plant and intervention set. Still, it reinforces the value of combining workplace discipline with equipment care and structured problem solving.
The broader lesson is straightforward: do not deploy SMED to solve a kiln quality problem, and do not deploy 5S as a substitute for process engineering. 5S improves organization, access, cleaning, and visual control. It can support defect prevention, but it cannot independently correct an unstable firing profile.
For leaders considering broader investment in materials capability, Advanced ceramics drive new industrial market offers related context on how ceramic innovation can alter operating and talent requirements.
Align Leadership And Specialized Talent
The Operating Model Changes The Leadership Profile
Lean improvement creates a people requirement that is easy to miss. A plant can appoint a continuous improvement manager, but that role will struggle without production, quality, maintenance, engineering, and #SsupplyChain leaders who use the same operating rhythm.
The most relevant executive and senior leadership questions are practical:
• Can the operations leader interpret yield, OEE, changeover, and defect data by product family?
• Does the maintenance leader have authority and systems to move from reactive repair to planned and autonomous maintenance?
• Can the quality leader distinguish containment from true root cause correction?
• Can plant leadership balance throughput demands against kiln, dryer, and safety limits?
• Does the organization have supervisors who can coach standard work across all shifts?
These are hiring and development questions, not just technical questions. A manufacturing executive who has only managed discrete assembly may need support to lead a continuous thermal process. Conversely, a technically strong kiln specialist may need broader capability in workforce engagement, capital planning, customer service, and cross functional management.
When Conventional Hiring May Fall Short
Specialized #CeramicLeadership searches can be difficult when a role requires both process knowledge and management range. A plant may need a leader who understands firing, forming, glaze systems, maintenance reliability, Lean operating systems, and commercial urgency. The available candidate pool may be much narrower than the job title suggests.
An executive search process can be justified when the business risk of a vacancy is high, the required capability is specialized, confidentiality matters, or the leadership role affects a major turnaround, expansion, quality recovery, or succession plan. It is not automatically necessary for every opening. A well defined internal candidate pool or a less specialized supervisory position may be better served by direct hiring and development.
We would encourage decision makers to define the operating problem before writing the job description. “Improve production” is not a capability profile. “Raise first pass yield in a high mix tile plant while improving kiln reliability and reducing changeover losses” is much closer to one.
The risks of a prolonged vacancy are operational. Projects can lose ownership, preventive maintenance routines may slip, quality decisions may become inconsistent, and supervisors may be forced into short term firefighting. Those risks should be assessed locally rather than assumed. Fostering manufacturing innovation strategies for success provides related perspective on building leadership systems that support process improvement and innovation.
Frequently Asked Questions
What Does Lean Manufacturing Mean In Ceramic Tile Production?
It means improving the flow of saleable tile by reducing defects, waiting, rework, downtime, excess handling, unnecessary inventory, and setup loss. The focus should be on the complete route from raw materials through packing, not one department’s local output.
Which Production Steps Usually Create The Most Waste?
The answer depends on the plant, but pressing, drying, glazing, firing, sorting, and packing all create distinct losses. Start with data. Separate pre kiln defects, kiln defects, post kiln defects, breakage, downtime, and changeover time before selecting a project.
Which Lean Tool Is Best For Kiln Related Defects?
No single tool is best. Root cause analysis should lead, supported by standardized #OperatingConditions, maintenance discipline, visual controls, and defect stratification by kiln zone, product family, loading pattern, and shift. Use TPM when failures or condition issues drive the loss.
Can 5S Reduce Ceramic Tile Rejects?
It can help indirectly by improving cleaning, organization, material identification, inspections, and early detection of abnormal conditions. It should not be presented as a direct cure for thermal defects, poor body formulation, or unstable glaze application.
When Should A Plant Use SMED?
Use SMED when changeovers consume meaningful productive capacity or introduce recurring startup defects. It is most valuable when a plant runs many sizes, designs, colors, molds, or glaze combinations. Avoid making it the first project if quality losses or equipment breakdowns are clearly larger constraints.
How Should A Plant Measure Lean Results?
Track first pass yield, defects by stage, breakage, OEE, changeover time, lead time, work in process, maintenance response, and customer delivery performance. Compare results by product family and shift. Use a stable baseline so changes in volume or mix do not create false improvement claims.
Are International Ceramic Lean Results Transferable To United States Plants?
They are useful hypotheses, not guarantees. Available case evidence comes from international operations, and directly comparable United States ceramic tile plant data is limited. A United States plant should validate results against its own product mix, energy profile, workforce practices, safety obligations, environmental controls, equipment age, and market conditions.
Resources And Citations
• SciSpace hosted paper — “An Empirical Study of Lean Production in the Ceramic Tile Industry in Spain”
https://scispace.com/pdf/an-empirical-study-of-lean-production-in-the-ceramic-tile-1ysf9tutco.pdf
• Taylor & Francis — “Implementation of an Integrated Framework of Lean Manufacturing and Industry 4.0 toward Sustainability: A Case Study of the Indian Ceramic Industry”
https://www.tandfonline.com/doi/full/10.1080/10429247.2024.2440248?af=R
• Springer — “Lean Manufacturing Implementation in Ceramic Industry: A Case Study”
https://link.springer.com/chapter/10.1007/978-3-030-44248-4_3
• LACCEI Proceedings — Production management model based on TPM and SMED
https://proceedings.laccei.org/index.php/laccei/article/download/2783/2778/5564
• University of Lima Institutional Repository — “Manufacturing Through Lean: A Case Study in Peru”
https://repositorio.ulima.edu.pe/archivo/5450d191-0921-4346-a512-ac60ddcb6466/descargar?idItem=1a04367c-b282-42b5-b4b8-f61ad3b14f3f&idColeccion=8208dc95-8e3a-4da9-a338-b44f55b6a0f3
BrightPath Associates — Ceramics 4.0: Powers of Smart Manufacturing: https://brightpathassociates.com/ceramics-4-powers-future-of-smart-manufacturing/
Find your next leadership role in Glass, Ceramic, Concrete Industry today!
Stay informed with the latest insights on Glass, Ceramic, Concrete Industry!