
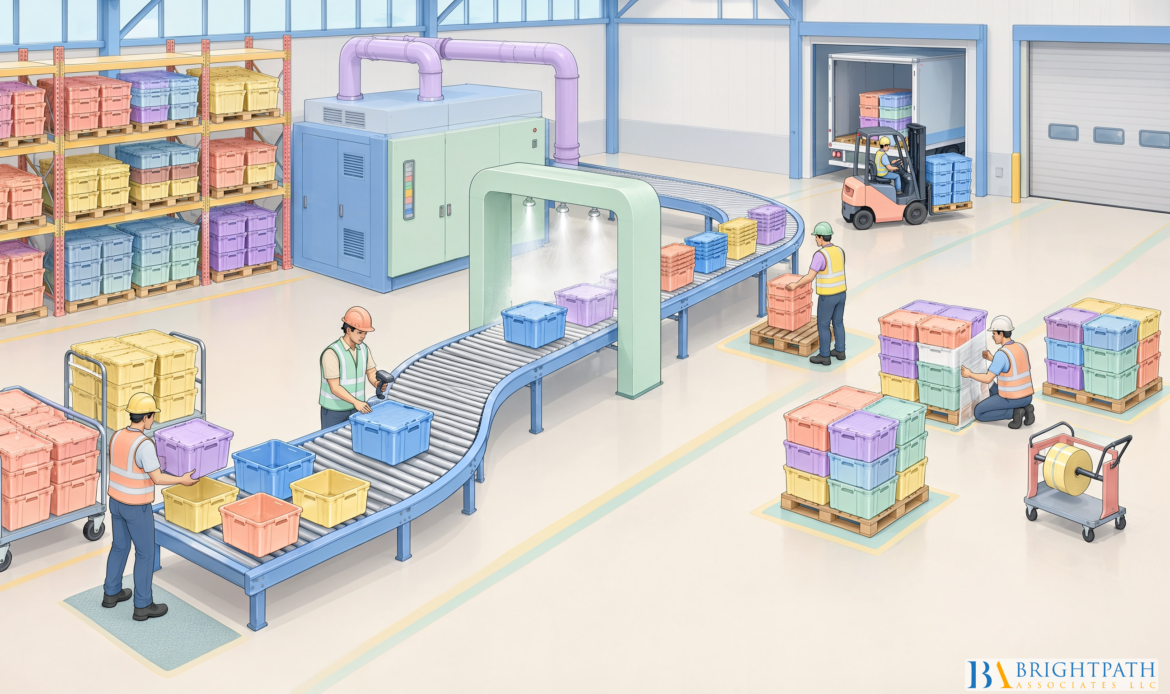
#ReturnablePackaging is not automatically cheaper than single-use packaging. The answer depends on whether your reverse supply chain can recover containers quickly, reliably, and at a cost that does not erase savings from reuse. Logistics of Returnable Packaging: Is Your Reverse Supply Chain Cost-Efficient For PACKAGING AND CONTAINER INDUSTRY is ultimately a question about transportation lanes, fleet utilization, empty-container cube, labor, loss, and leadership discipline—not just a comparison of container purchase prices.
For packaging and container manufacturers, the financial risk is clear. A durable tote, crate, pallet, drum, or intermediate bulk container may last for many trips, but it also becomes a tracked business asset. If it sits at a customer site for weeks, is sent to the wrong location, or requires costly cleaning and repair, the company must fund more inventory to keep production moving.
Table Of Contents
- Measure The Full Cost Of Reuse
- Design A Reverse Supply Chain That Can Close The Loop
- Key Takeaways
- Frequently Asked Questions
- Resources And Citations
Measure The Full Cost Of Reuse
Start With Total Delivered Cost, Not Packaging Price
A returnable packaging program should be judged against the cost of delivering and recovering a usable container, not against the price of a corrugated box or disposable pallet. Reusable transport packaging can improve operational efficiency, reduce costs, and simplify supply-chain operations, as described in the EPA guidance on reusable transport packaging. Those benefits are possible, but they are not guaranteed by durability alone.
The most useful comparison is between single-use cost per shipment and returnable cost per completed productive trip. Single-use packaging is usually straightforward: purchase, pack, ship, and dispose. Returnable packaging introduces a loop. The loop has value only when containers return in usable condition often enough to spread their initial cost across many shipments.
| Cost Element | Single-Use Packaging | Returnable Packaging |
|---|---|---|
| Container purchase | Recurs on every shipment | Upfront investment spread across completed trips |
| Forward transportation | Usually included in shipment cost | Includes loaded container weight and cube |
| Return transportation | Usually none | Empty backhaul, consolidation, or dedicated recovery freight |
| Labor | Packing and disposal handling | Packing, receiving, sorting, marshalling, and return preparation |
| Quality control | Limited after delivery | Inspection, cleaning, wash validation, repair, and rejection handling |
| Asset risk | Low after delivery | Loss, damage, theft, misrouting, and excess fleet requirements |
A credible lifecycle calculation must include more than the container invoice. MHL News’ analysis of returnable-packaging logistics identifies #ReturnTransport, sorting, marshalling, washing, repair, administration, fleet size, and number of uses as material economic inputs. This is why a program can report lower packaging purchases while still increasing total delivered cost.
We recommend that executives separate the results into two views:
• Packaging savings: avoided purchases of corrugated, stretch wrap, expendable pallets, dunnage, or disposal services.
• Network savings: the change in total transportation, handling, labor, inventory, quality, and working-capital cost.
The second view is the decision metric. A program that lowers packaging spend but requires frequent dedicated empty returns may not be cost-efficient overall.
Calculate Break-Even At The Lane Level
There is no universal number of trips that makes a tote, crate, or IBC economical. Secondary #MarketResearch sometimes cites cost parity after roughly eight to 12 trips, but that estimate should not be treated as a U.S. industry benchmark. A dense, repeatable automotive loop could break even sooner. A seasonal, one-way distribution lane might never do so.
A practical model is:
Compare that figure with the cost of expendable packaging per shipment.
Expected replacement cost matters because a 5% annual loss rate does not simply create a write-off. It also reduces available fleet capacity. If demand is stable, replacement purchases may be necessary before the original assets have achieved their planned number of turns.
Use lane-level inputs rather than company-wide averages:
- Forward shipment frequency: How many loaded shipments move each week or month?
- Return rate: What share of empty containers are actually recovered within the target cycle?
- Return cycle time: How many days pass between outbound shipment and usable return?
- Empty-return cube: How many empties fit in a trailer, especially if containers nest or collapse?
- Backhaul availability: Can an existing carrier return empties at marginal cost, or does the company pay for a dedicated move?
- Service cost: What do sorting, washing, inspection, repair, storage, and administration cost per asset or trip?
A container that returns on a vehicle already traveling toward the plant may add little freight cost. The same container returned from a remote customer on a dedicated truck can become expensive quickly. This is the central distinction between a packaging decision and a network-design decision.
A returnable-packaging cost analysis published by Acta Technica similarly includes forward and return transport, storage, repair, cleaning, administration, disposal, required fleet quantity, and number of uses. The required fleet quantity deserves particular attention because it turns late returns into a capital problem.
Treat Dwell Time As Working Capital
Dwell time is the period when a container is inactive: waiting at a customer, sitting in a trailer yard, held for sortation, awaiting wash validation, or queued for repair. It is easy to describe dwell as an operational inconvenience. Financially, it is an inventory issue.
Consider a plant that needs 1,000 totes in circulation for a 10-day cycle. If average cycle time rises to 20 days because customer pickup is inconsistent, the program may need close to twice the fleet to prevent stockouts, assuming shipment demand is unchanged. The tote price has not changed. The capital tied up in totes has.
This is why a reverse-logistics dashboard should track more than loss. It should show the following metrics by customer, lane, and container type:
• Return rate within agreed time window
• Average and median cycle time
• Productive turns per container per year
• Loss and damage rate
• Cost per recovered container
• Empty miles and empty trailer utilization
• Wash rejection and repair rate
• Containers overdue by customer or location
A slow return may be less damaging than a lost container, but not always. A consistently slow customer can require a permanent fleet increase. We would price that customer’s dwell time into the #ServiceModel rather than treating it as a minor exception.
Design A Reverse Supply Chain That Can Close The Loop
Build The Return Network Before Buying The Fleet
The strongest returnable systems are designed backward from recovery. Before purchasing a large fleet, define where empties will be collected, who owns each handoff, where containers will be inspected, and how exceptions will be resolved.
The reverse flow usually has six stages:
- Customer unloads product and segregates empty packaging.
- Containers are scanned or otherwise recorded at the handoff point.
- Empties are marshalled for pickup or consolidation.
- Assets move through a backhaul, milk run, pool depot, or third-party recovery route.
- Containers are inspected, cleaned, repaired, and released for reuse.
- The fleet is rebalanced to production or distribution locations.
Each stage should have a defined owner. Ambiguous ownership is a common source of asset shrinkage. If a customer assumes the carrier handles returns while the carrier assumes the consignee will stage empties, containers can remain uncollected for weeks.
Analytics should guide this design. For example, Distribution Center Analytics for Packaging Decisions explains why distribution data should shape packaging choices. For returnables, useful data includes dock dwell, outbound order patterns, trailer cube utilization, damaged-container locations, and customer return behavior.
Choose The Right Ownership Model
The ownership model determines who carries capital risk and who enforces return discipline. No single structure works for every packaging format.
| Model | Best Fit | Main Benefit | Main Risk |
|---|---|---|---|
| Customer-owned fleet | Closed loops with stable suppliers and customers | Direct control over specifications and asset standards | High capital exposure and recovery burden |
| Supplier-managed fleet | Packaging supplier supports a defined customer network | Specialized maintenance and service capability | Limited flexibility if network changes |
| Centralized internal pool | Multiple plants or business units with shared assets | Better fleet balancing across locations | Requires strong governance and visibility |
| Third-party pool | Broad, multi-user distribution networks | Can reduce individual fleet ownership | Fees, access rules, and less direct operational control |
#CustomerOwnership can make sense when routes are predictable and assets are specialized. A custom aerospace crate or chemical IBC may require strict engineering, cleaning, and handling controls. Pooling is often more attractive for standardized assets moving through many locations, where utilization can improve when idle containers are shared.
A vendor-reported example illustrates the potential operational scope. TransPak’s reusable-crate refurbishment program describes a U.S. aerospace case combining refurbishment, tracking, storage, pickup, and delivery. The supplier reports managing more than 16,000 crates and refurbishing more than 7,000 during 2025, with estimated savings of $5 million. It is useful as an operating example, but it is not an independently audited benchmark for other networks.
Make Empty Cube And Contamination Part Of The Decision
Collapsible and nestable containers can reduce empty-return cube, but they are not automatically the best option. A collapsible design may add labor, create ergonomic issues, or have lower durability than a rigid alternative. The decision should compare cost per usable returned unit, not just the number of empty units that fit in a trailer.
For example, if folding a container doubles empty trailer density but requires two extra handling touches at every customer dock, the freight savings must exceed the added labor and damage risk. High-volume lanes with constrained trailer capacity may justify that trade-off. Low-volume locations may not.
Contamination creates another limit. Food-contact containers, chemical drums, pharmaceutical packaging, and residue-sensitive IBCs may require validated wash processes, segregation, documentation, and rejection procedures. A dirty container is not merely unavailable inventory; it may require additional transport, rework, disposal, or specialized cleaning.
The sustainability case remains meaningful, but it should be measured through lifecycle assessment and actual operating results. A review published by Atlantis Press on reusable-packaging lifecycle cost analysis found that a modeled multi-trip reverse-logistics arrangement reduced packaging cost and packaging waste relative to disposable packaging under the study conditions. The phrase under the study conditions matters. A circular economy #PackagingStrategy works best when reverse movement is operationally realistic.
This is also where senior leadership matters. The initiative crosses procurement, manufacturing, transportation, quality, customer service, finance, sustainability, and often third-party logistics. A program can fail when one executive owns container procurement while another owns return freight and neither owns the combined economics.
For smaller and mid-sized firms, the leadership requirement is increasingly cross-functional. The operations leader must understand freight and service levels. The sustainability leader must understand lifecycle trade-offs. The finance leader must be able to assess fleet investment, loss exposure, and payback. Companies pursuing Leveraging Contract Packaging Services should also clarify whether the contract packager, brand owner, or logistics provider controls reusable assets and recovery performance.
Establish Controls Before Scaling
Tracking is useful when it changes a decision. Barcodes may be sufficient for a controlled loop with fixed customers. RFID may be more appropriate when containers move across busy distribution centers, multiple carriers, or pooled networks. GPS is generally more suited to higher-value transport assets than to every low-cost tote.
The point is not to track everything at the highest possible cost. It is to detect exceptions early enough to recover assets and prevent recurring dwell. Controls should include:
• A unique asset or batch identifier
• Scan points at shipment, receipt, staging, pickup, wash, repair, and redeployment
• Customer return windows and escalation rules
• Chargeback or deposit terms where commercially appropriate
• Clear criteria for repair, retirement, recycling, and replacement
• Monthly review of losses, overdue assets, and lane-level economics
From a talent perspective, this also affects hiring. A packaging executive responsible for returnables needs more than materials knowledge. The role may require experience with transportation procurement, warehouse systems, quality controls, data analysis, customer contracts, and circular economy packaging. Conventional hiring processes can miss that combination when job descriptions focus only on packaging engineering or sustainability credentials.
When a senior operations or supply-chain role stays open, the risk is not simply slower hiring. It can mean delayed network redesign, unchallenged freight assumptions, weak pool governance, and capital committed before the recovery model is tested. Executive search may be justified when the role requires a narrow combination of packaging, logistics, financial, and change-management capabilities that is difficult to assess through general recruiting channels.
Sustainability should remain a measured part of the business case, not a substitute for one. Sustainable Solutions for Package Delivery provides additional context on how packaging choices connect environmental and #DeliveryConsiderations. In a returnable system, the practical question is whether lower waste is achieved alongside reliable recovery and acceptable total cost.
Key Takeaways
The Decision Is About Turns, Not Intent
Returnable packaging is most likely to be cost-efficient when shipment volumes are repeatable, customers return empties on time, backhaul capacity exists, and containers complete enough productive turns to absorb purchase and service costs. It is less attractive for fragmented, seasonal, distant, or largely one-way lanes without a credible recovery plan.
Leadership Should Own The Whole Loop
The reverse supply chain should have one accountable business owner and shared measures across operations, logistics, finance, quality, procurement, and sustainability. Do not allow packaging savings to be reported separately from return freight, container loss, repair, storage, and added fleet capital.
Test Before You Scale
A controlled pilot on one or two dense lanes can establish actual return rates, cycle times, empty cube, wash rejection, handling labor, and customer compliance. Use those findings to revise the fleet model before committing to a network-wide purchase.
Frequently Asked Questions
What Is Returnable Packaging?
#ReturnablePackaging is durable transport packaging intended for repeated use between supply-chain partners. It includes pallets, crates, totes, reusable plastic containers, drums, IBCs, racks, and specialty shipping cases. Unlike expendable packaging, it requires a reverse supply chain to recover, inspect, clean, repair, and redeploy the asset.
When Does Returnable Packaging Become Cheaper Than Single-Use Packaging?
It becomes cheaper when avoided single-use purchases and disposal costs exceed the returnable system’s annualized capital, freight, handling, cleaning, repair, storage, administration, and loss costs. There is no dependable universal trip count. Calculate break-even by container type and shipping lane.
How Should Return Freight Be Allocated?
Allocate return freight based on the capacity each container uses in the empty move. Consider cube, weight, nesting or collapsibility, trailer utilization, pickup frequency, and whether the return uses existing backhaul capacity. Avoid spreading dedicated recovery freight evenly across all shipments if only a few lanes cause the cost.
What Return Rate Is Needed For Cost Efficiency?
The needed rate depends on asset price, fleet size, replacement cost, and planned turns. A low-cost crate may tolerate more loss than a high-value engineered container, but both need a target return window. Model several scenarios, such as 95%, 90%, and 80% on-time recovery, before approving the fleet investment.
Is A Container Pool Better Than Owning The Fleet?
A pool can be useful when standardized containers move among many users and shared utilization reduces idle inventory. Ownership may be better when assets are proprietary, highly regulated, specialized, or used in a stable closed loop. Compare total access fees, service levels, control rights, loss responsibility, and availability during peak demand.
How Do Cleaning And Contamination Affect Costs?
Cleaning can be a routine cost or a major constraint. Food, chemical, pharmaceutical, and residue-sensitive applications may require validated processes, segregation, inspection, and rejection handling. A container that cannot be safely or economically returned to service should be included in the loss and #DisposalModel.
Which KPIs Matter Most?
Track completed turns per year, on-time return rate, cycle time, loss rate, repair rate, wash rejection rate, empty trailer utilization, recovery cost per container, and total cost per productive trip. Review these by lane and customer, not only as a network average.
Resources And Citations
• US Environmental Protection Agency + Use Reusables: Fundamentals of Reusable Transport Packaging — https://archive.epa.gov/smm/web-academy/web/pdf/smm812_lehrer.pdf
• MHL News + Logistics Issues in Returnable Packaging — https://www.mhlnews.com/transportation-distribution/article/22034855/logistics-issues-in-returnable-packaging
• Acta Technica Széchenyi István University + Returnable-packaging cost analysis — https://acta.sze.hu/index.php/acta/article/download/491/477/1694
• Atlantis Press + Review of Life Cycle Cost Analysis for Reusable Packaging — https://www.atlantis-press.com/article/126006696.pdf
• TransPak + Reusable Transport Packaging & Shipping Crates — https://www.transpak.com/crating/refurbishment/
• BrightPath Associates: Sustainable Solutions for Package Delivery — https://brightpathassociates.com/green-packaging-sustainable-solutions-for-package-delivery/
Find your next leadership role in Packaging and Containers Industry today!
Stay informed with the latest insights on Packaging and Containers Industry!